
Games of chance are often people’s first exposure to statistics. Settlers of Catan is a game that revolves around the probability distribution of two independent 6-sided die rolls. The game consists of hexagons with one of four possible resources available. These hexagons are normally in a random configuration. Each hexagon receives a random number token. These tokens range from 2 to 12, with the exception of 7. In Catan, a nonplayer piece called the ‘robber’ is moved when a 7 is rolled. The player who rolled a 7 has the ability to place the robber, blocking other players from those resources and taking a resource from an adjacent player. Each token has circular indicators that show the relative probability of that number being rolled. For example, 6 and 8 have the highest probability of being rolled when excluding 7. These tokens have 3 red circles. 2 and 12 have the lowest probability, and have 1 black circle.
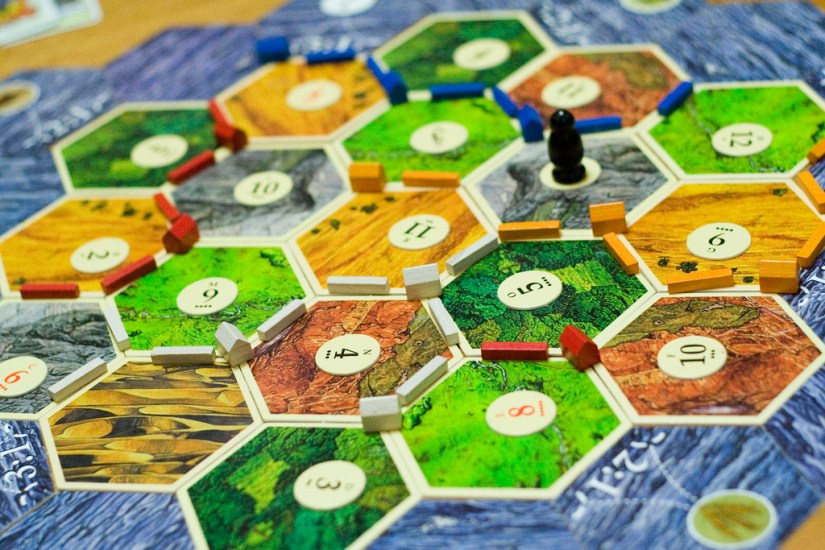
Players begin the game by placing two settlements onto nodes intersecting 3 hexagons. Due to the relative availability of high-probability hexagons, the starting position is most commonly believed to be the key indicator of game success. When the die are rolled, the sum is used to determine which resources are collected. If a hexagon has a number token equal to the die roll sum, any player intersecting the hexagon may collect that resource. The objective of the game is to obtain ten points before any other player. Points are obtained by spending resources.

The objective of this analysis is to determine the most likely determinants of winning the game. Players often accuse the relative probability of rolling a number as the determinant of their winning or losing (“luck”). Another popular assumption is that the starting position is key to winning the game. Players are allowed 2 starting positions, and the first position is the players first choice chronologically.The dataset was obtained from Kaggle.
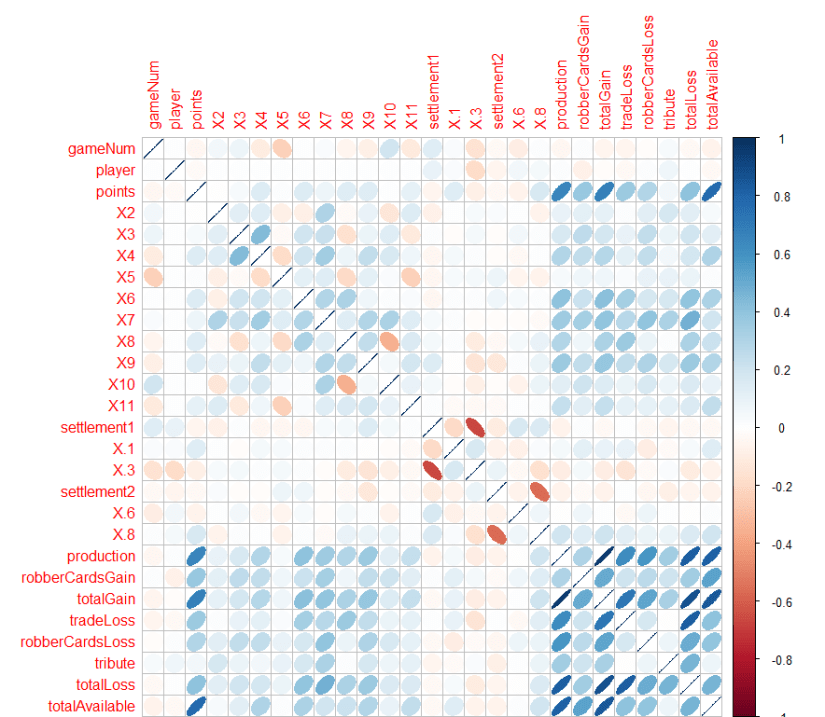
The pairwise correlation plot reveals that production related variables (lower 8) are positively correlated. The numeric token on the first hexagon intersected by each starting settlement is negatively correlated with the other 2 hexagons. This was unexpected, but other analysis methods didn’t show a strong relationship.
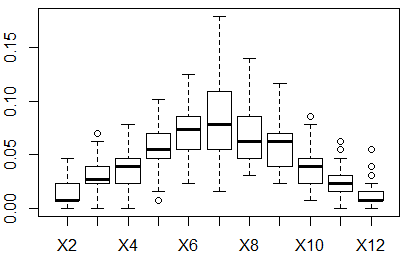
The boxplot shows the number of times each possible 2D6 roll occurred (in percentages). This shows good recovery of the underlying probability distribution.
Decision Tree

A decision tree provides ranges of values for a variable that correspond to a given correlational ‘choice’. The tree is produced with respect to some response variable, in this case the total number of points each player gets. The most important variable is at the top, totalAvailable, which is a measure of the total number of resources available to the players in the game. Both robberCardsGain and robberCardsLoss also measure this. The second hexagon that players initially place their settlements by is also important (X2) as was the number of 8’s rolled (X8).
K-Means Clustering
To read a K-means graph, you look for visual clusters along a particular variable. In this case, we care about game points, the second column. Reading across the second row, we can look for clusters to see if any other variables produce an effect on the number of points. Most variables can be seen to have some effect on the number of points a player gets, particularly the number of 2’s or 12’s rolled. However, the ‘game productivity’ metrics are the most important in determining a player’s points – productivity, cards from the robber, total resource gain, loss due to trading, loss due to the robber, and tribute (the last 6 columns).

Conclusion
This analysis of Settlers of Catan game play data demonstrates that game productivity is the best predictor for a player to win. Game play productivity includes measures of the number of resources a player gathers or steals from other players. The number of resources gathered in a game is influenced both by random chance as well as player strategy. Some point-making strategies result in fewer resources gathered. Of particular interest is the lack of effect the starting settlement choices have on player outcome, although initial analysis did reveal some negative correlations between starting choice and total points. This may be because the majority of starting positions were generally “mediocre”, including a variety of numeric tokens. It seems likely that a poor starting position, consisting of tokens with low probability, would still result in a poor player outcome, since the probability of the tokens being rolled does affect initial game productivity.
The effect of in-game luck is not an important factor in these analyses. A reasonable interpretation of these analyses is that player strategy is of significant importance, since game productivity measurements are (indirect) measures of the effect of strategy. Around 2/3 of respondents rated Catan as primarily luck based (over 50%) on a popular online forum. Many players cited initial settlement placement as another key component of game play. Both these intuitions are not supported by these analyses.
