Many people are aware of the normal distribution or “bell curve”. What are some other probability distributions and when are they useful?
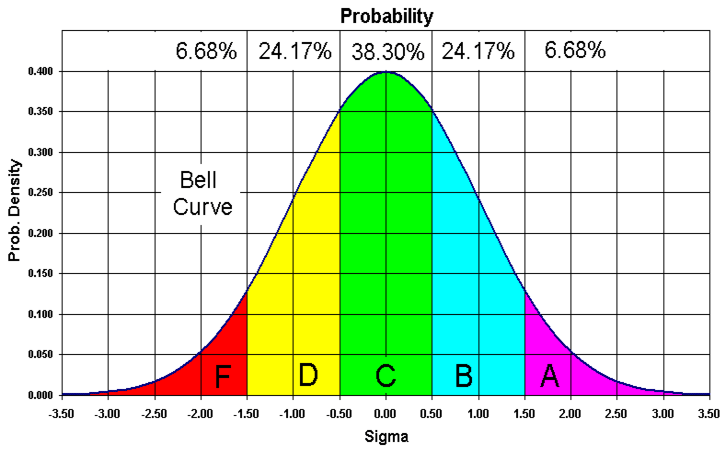
You can think of a probability distribution as a collection of the number of times something happened. For example, how many students get which grade (70%, 73%, 94%, etc). We can visualize this type of information using a bar graph or histogram.

The normal distribution is nice because its symmetrical. However, many things are not symmetrical. Imagine the number of people that get a certain range of income. Since you can’t make less than $0 there is a lower boundary, but there is no upper boundary. This makes the distribution skewed.

You can think of this as a skewed normal distribution, but this doesn’t mean much mathematically. There are other probability distributions with other shapes for situations that are not symmetrical.
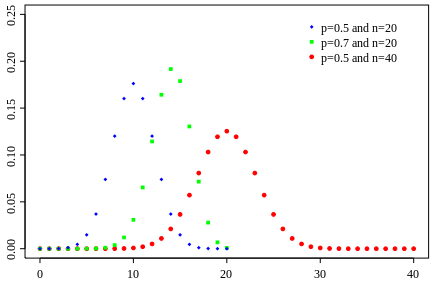
Binomial Distribution
This is probably the second most popular distribution. The binomial distribution is based on the chance that something occurs, such as flipping a coin and getting heads or tails, or rolling a die. The binomial distribution is discrete, meaning it only uses whole numbers.
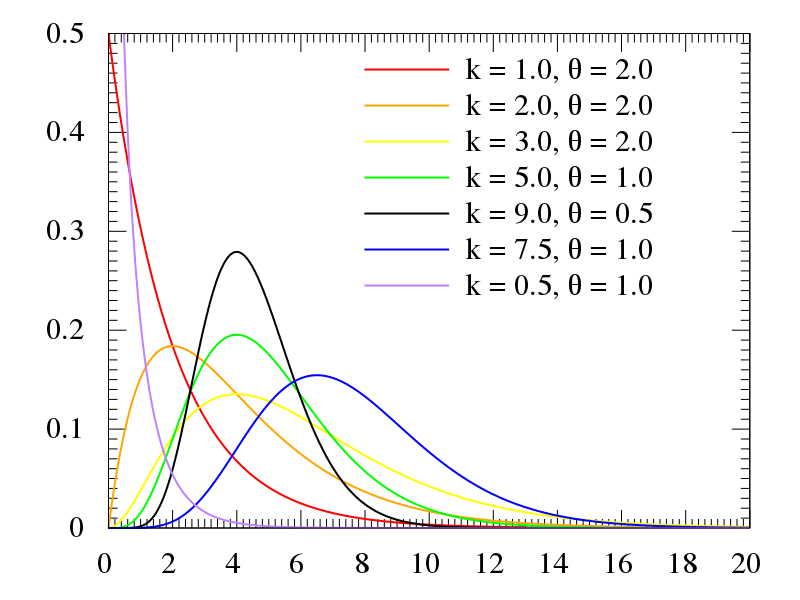
Gamma Distribution
This distribution would be a better fit for income data, since with certain parameters it can be very skewed. Since it is so flexible, it is often used in Bayesian statistics to define a prior distribution. See my introduction to Bayesian statistics here.

Beta Distribution
The beta distribution is similar to the gamma in that it is very flexible, but it is only defined between 0 to 1. It is useful in Bayesian statistics when you are looking at binomial data since the chance something occurs is always between 0 and 1.

Cauchy Distribution
The Cauchy distribution is my favorite because its mean does not exist! If your data came from a cauchy distribution, it would not converge to an average value. Data like this are highly variable. Chemical chromatograms are like this, since so many variables influence the data.

