
Recently I’ve been thinking about developing scientific web apps. I wanted to discuss my experiences with making web apps, and an overview of what I’ve made. A more technical/development discussion will follow in a subsequent post.
I was introduced to R Shiny at a gerrymandering workshop a few years ago. Since then, I’ve created a few apps that I’d like to share. The first two are database-oriented, developed as a volunteer (a third database app is discussed previously – IMB). The last three are educational and simulation-based.
Searchable fellowships/REUs for Científico Latino
Científico Latino is an organization aimed at promoting awareness of opportunities to minority scientists. As part of this, they have nice databases of undergrad research opportunities (REUs) and fellowships. I developed a searchable tool (based on citizenship status and position) to help people find opportunities that they are eligible for quickly.
Searchable database of plant scientists
Diversify Plant Science has a mission to make diverse plant scientists easier to find – for identifying mentors, speakers (read here about why these things are helpful). Since the use cases are many, and diversity means many things, I wanted to create an interactive database for people to more easily find what they are looking for.
Hardy Weinberg simulator
R shiny isn’t just good for nice databases and tables – it also makes nice simulators. I developed a Hardy-Weinberg genetic population simulator for LSU. This is a random walk simulator based on the Hardy-Weinberg equation. This simulator includes a tutorial mode, and produces graphs, statistics, and histogram so students can easily generate nice reports and work through a large number of possible statistical questions. I wrote about it here.
Enzyme kinetics simulator
Thanks to a forthcoming paper with an undergrad, the functionality of this simulator is currently being expanded. This simulator is based on a mathematical model (two versions). Students can run simulated experiments for any enzyme, although the paper is focused on potato catechol oxidase (a common undergrad lab enzyme, thanks to its low cost and easy extraction).
Students can also fit their data to the models. The paper will include some guided questions and worksheets to walk students through the model. We have implemented two models to accommodate different time requirements (eg, more complex model might take longer).
The code will also be available if student exposure to R is desired. The current working version is available here under the Catechol Oxidase tab.
Intro biology simulators: Photosynthesis and plant growth; membrane potential
Finally, two miscellaneous simulators aimed at some topics commonly addressed in undergrad intro bio. They are available here.
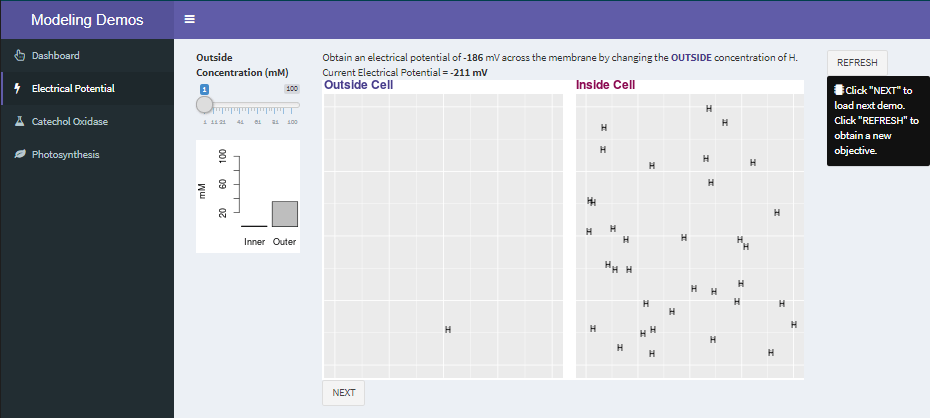
First, the membrane potential simulator walks students through balancing the ions inside and outside the membrane. Students often get confused about the signs of membrane potential; so seeing the impact of changing the amount of ions via a slider on the voltage should help.
Secondly, the plant growth simulator focuses on the relationship between absorption spectra, light color, and carbon dioxide usage. Different plants have different absorption spectra, which can be identified using literature or via simple paper chromatography experiments. Plants grown under different colors of light have a subset of wavelengths available to them.
That’s not all – different wavelengths have different energies. In this simulator, students can modify the absorption spectra, the wavelengths of light available to the plant, and visualize the relative CO2 usage via a simple simulator. The inverse relationship between wavelength and energy is also provided. I found this helpful to my students.
